2. 景宁畲族自治县望东垟高山湿地自然保护区管理局, 丽水 323500;
3. 福建农林大学林学院, 福州 350002
2. Wangdongyang High Mountain Wetland Natural Reserve Administration, Lishui 323500;
3. Forestry College, Fujian Agriculture and Forestry University, Fuzhou 350002
生物质燃烧排放大量污染物, 显著影响大气环境和人类健康(Zhang et al., 2017;靳全锋等, 2017a).露天生物质燃烧是生物质燃烧重要组成部分, 主要由森林、灌丛、草地、沼泽和秸秆火组成(Qiu et al., 2016;Wu et al., 2018), 是排放污染性气体和颗粒物重要来源, 研究显示全球每年有8600 Tg生物质燃烧(Levine et al., 1991), 每年有2~5 Pg碳排放来源于生物质燃烧(Soares et al., 2009), 有40%的CO、35%的颗粒物和20%的NOx来源于生物质燃烧(Langmann et al., 2009).研究显示美国每年有39%的CO和20%的PM2.5来源于生物质燃烧(Urbanski et al., 2009), 欧洲露天燃烧排放是生物质排放主要来源, 巴塞罗纳每年有3%的PM10和5%的PM2.5来源于秸秆露天焚烧(Reche et al., 2012;Garcia-Hurtado et al., 2014). Yan等(2006)研究显示中国每年有509.0 mt生物质燃烧, 排放NOx、SO2、CO、CO2、CH4、NMHC、PM和BC总量分别为1.09、0.17、59.30、946.63、2.20、3.03、3.62和0.43 mt(田贺忠等, 2011).生物质燃烧排放大量污染性气体(CO2、CO、NOx、SO2、VOCs、烃类和醛类)和颗粒物(TSP、PM10、PM2.5和PM1), 显著影响空气质量(Zha et al., 2013;Zong et al., 2016). CO2、CH4、N2O和颗粒物加快长波辐射吸收, 促进气候变暖(Sun et al., 2016);PM2.5、EC、NOx和VOCs大量排放促进太阳光吸收、散射、环境光化学烟雾及阴霾的形成, 降低区域空气质量和能见度(Cheng et al., 2014);卤代烃大量排放破坏O3层, 增强区域紫外线(Li et al., 2018).生物质燃烧释放的烟气严重影响人类健康, 大量CO、NOx和VOCs等严重刺激眼、鼻、咽喉及皮肤, 损伤肺粘膜而引发哮喘, 甚至引起白血病和癌症(Udeigwe et al., 2015).此外, 烟气中大量NOx、SO2和HCOOH等沉降, 影响土壤pH和土壤理化性质(Sinha et al., 2003).因此, 解析生物质燃烧烟气排放对大气环境评估具有重要意义.
浙江是我国主要生物质产区, 森林覆盖率高达59.07%.每年有6.85 mt秸秆和7.43 mt林木资源燃烧, 释放31.73 kt的PM2.5(靳全锋等, 2017b; 2017c).研究显示浙江区域每年有600余次森林火灾, 过火面积为6.0×10³ hm2;生物质燃烧排放大量污染性气体和颗粒物(靳全锋等, 2017b).因此, 合理估算浙江区域露天生物质燃烧排放对大气环境评估至关重要.鉴于此, 本研究以2001—2016年MODIS影像数据为研究对象, 运用排放因子法, 估算浙江区域露天生物质燃烧排放污染物时空格局.主要研究目标为:①估测出2001—2016年浙江地区生物质燃烧总量.②估算浙江地区露天生物质燃烧排放污染物总量;③分析浙江露天生物质排放污染物时空格局, 本研究可为相关大气模型研究和大气环境污染评价提供基础性科学依据.
2 材料与方法(Datas and methods) 2.1 研究区概况浙江省位于中国东南部, 东经118°01'~123°10', 北纬27°06'~31°11', 区域面积为1.02×10⁵ km2.全省地貌类型复杂, 地势西南向东北倾斜, 南部多丘陵;浙南、浙北、浙西、浙东和浙中分别是山地、平原、山地丘陵、滨海岛屿和丘陵盆地等5种地貌类型.该区域地处亚热带季风气候区, 冬季寒冷干燥、夏季雨热同期、四季分明、光照充足.平均气温为15~18 ℃, 最低和最高温度分别为-17.4~-2.2 ℃和33.0~42.9 ℃;平均年降水量为1100~2000 mm.该区域乔木杉木林、松木林、青冈等主要树种占林分总面积80%以上;农作物主要以水稻、小麦、玉米、豆类和油菜为主要粮食作物. Jin等(2018)研究显示浙江作物和林火高发区, 2000—2014年共发生秸秆火2万余次, 年均超1500次, 森林火灾近万次, 年均超600次, 且该区域林火90%以上受人为因素影响(靳全锋等, 2017b; 2017c).
 |
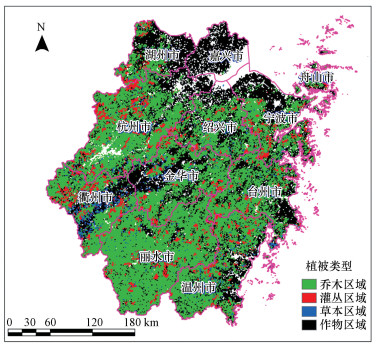
| 图 1 浙江地区不同植被空间分布 Fig. 1 The spatial distribution of vegetable type in Zhejiang |
森林和草地火灾面积数据基于MODIS-MCD64A1火灾面积产品(https://e4ftl01.cr.usgs.gov/).MCD64Al产品是空间分辨率为500 m, 月尺度产品, 能精准检测区域森林草地火灾.目前MODIS火点受自然因素影响, 成功监测率为90%左右, 但通过滤除噪声、耀斑及云的干扰, 不同区域和季节草地成功监测率高达100%(Zhou et al., 2006), 因此, 本研究使用MCD64A1产品与中国行政区划图(1:100万)和中国植被覆盖图是空间分辨率为1 km的产品(http://www.resdc.cn/data.aspx?DATAID=184)进行叠加分析, 获取燃烧区域植被类型和燃烧面积.
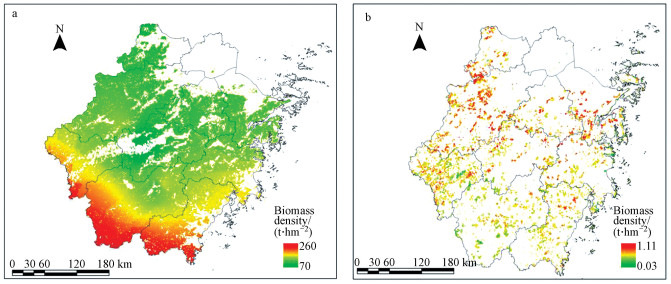
2.3 森林和草原密度时空分布浙江区域森林生物质密度基于Ni等(2001)研究成果, 运用克里金差值法得到浙江区域森林生物质密度图详见图 2a, 草地生物量密度基于Piao等(2007)研究成果, 运用生长季NDVI平均值与地上生物量关系模型, 绘制浙江区域草地地上生物量空间分布(图 2b).
 |
| 图 2 浙江区域乔木和草本生物质密度空间分布 Fig. 2 The spatial distribution of biomass density of forest tree and grass in Zhejiang |
根据浙江省统计年鉴(2002—2017年), 获取浙江各市秸秆产量数据, 参照国家发展改革委办公厅发布谷草比(http://www.ndrc.gov.cn), 计算各区域秸秆产量.查阅文献秸秆露天焚烧比例参照Jin等(2018)研究成果, 根据Akagi等(2011)、Kato等(2011)、Wu等(2018)、Zhang等(2008)、Zhou等(2017)、Huang等(2012)、Shen等(2010)、Mundo等(2013)和Guerette等(2017)研究结果认为水稻、小麦、玉米、豆类、油菜、草本、灌丛、温带针叶乔木、针叶落叶乔木、阔叶常绿乔木和阔叶落叶乔木平均露天燃烧效率分别为0.89、0.86、0.92、0.68、0.82、0.80、0.77、0.48、0.34、0.34、0.29和0.29.
2.5 排放因子排放因子是精确估测各类排放物总量的重要前提, 因此本研究基于国内外学者研究成果, 针对不同植被类型选用不同排放因子, 提高估测精度.本研究同时对众多研究结果取平均值作为不同植被类型排放因子(表 1).
| 表 1 不同植被类型排放因子 Table 1 The emission factors from different vegetable type |
森林和草本燃烧量用式(1)进行计算(Shi et al., 2015;Wu et al., 2018).

|
(1) |
式中, M为森林和草本燃烧量(t);A为燃烧面积(hm2);B为地上生物质密度(t·hm-2).
秸秆露天燃烧量计算用式(2)进行计算(Shi et al., 2015, Wu et al., 2018)

|
(2) |
式中, M为秸秆燃烧量(t);P为农作物产量(t);Ri为i种作物谷草比;F为露天燃烧比例.
2.8 露天生物质燃烧排放污染物计算露天生物质燃烧排放污染物利用公式(3)计算(Shi et al., 2015, Wu et al., 2018).

|
(3) |
式中, E为污染物排放量(t);Mi为i种露天生物质燃烧量(t);EFi为i种污染物排放因子(g·kg-1);η为燃烧效率.
2.9 秸秆污染物空间分布农作物秸秆露天焚烧具有较强时空分布特征, 传统统计方法很难高效统计其时空分布特征. MODIS影像数据能准确、快速探测到其时空分布格局, 被野火监测广泛应用.本研究基于MODIS秸秆火点数据产品运用空间权重法, 计算浙江省污染物空间分布格局.具体方法如下所示.
① 以浙江各市为单位, 统计各市区域内秸秆火点总数.
② 利用ArcGIS10.2将整个研究区域网格化(10 km×10 km), 并提取各网格内火点数量, 根据公式(4)计算每个网格各污染物排放量.

|
(4) |
式中, Ei为i网格污染物排放量, Ni为i网格内秸秆露天燃烧火点个数, Nk为k市总火点个数, Ek为k市总污染物总量.
2.10 不确定分析本研究使用IPCC(1997)提供排放清单不确定性评估方法. ①当不确定量通过加法合并时, 总体不确定性采用公式(5)计算;②当不确定量通过乘法合并时, 总体不确定性采用公式(6)计算.

|
(5) |
式中, Utotal为总体不确定性, xn和Un分别是不确定量和相关的百分比不确定性.

|
(6) |
式中, Utotal为总体不确定性, Un是每个量相关的百分比不确定性.
3 结果与讨论(Results and discussion) 3.1 浙江省露天生物质燃烧量本研究基于浙江区域MODIS-MCD64A1数据监测森林、灌丛、草地火灾面积数据及生物质密度和统计年鉴数据, 分别统计浙江2001—2016年植被类型露天燃烧总量, 并计算年燃烧量(表 2).结果显示不同植被类型露天燃烧总量存在差异, 浙江区域16年总燃烧生物质量为58.78 mt(3.67 mt·a-1), 其中乔木、灌木、草本、水稻、小麦、玉米、豆类和油菜露天燃烧量分别为202.18 kt、10.43 kt、300.1 t、46.66 mt、1.94 mt、2.45 mt、3.45 mt和4.06 mt, 年均分别为12.64 kt、0.65 kt、18.76 t、2.92 mt、121.37 kt、153.04 kt、215.49 kt和253.99 kt. 靳全锋等(2017b)研究显示浙江每年露天焚烧水稻、小麦、豆类和油菜分别为2.07 mt、101.0 kt、175.4 kt和280.8 kt, 该研究结果与本研究较为接近.
| 表 2 2001—2016年浙江区域露天生物质燃烧时间变化 Table 2 The temporal change of the open biomass burning in Zhejiang during 2001—2016 |
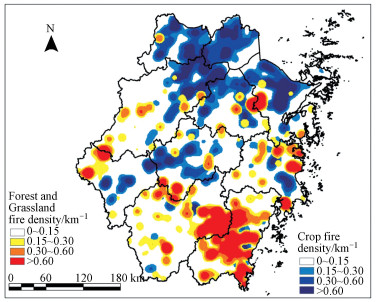
基于2001—2016年MODIS-MCD64A1森林和秸秆火点数据, 运用ArcGIS10.2在GWS-84投影下分别绘制为1 km×1 km网格, 将森林和秸秆火灾次数运用核密度原理, 绘制16年火点密度图(图 3). 2001—2016年浙江区域发生森林和秸秆火点分别为1783次和23257次, 年均111次和1454次, 不同植被类型火点空间分布不均衡, 森林火灾多集中在浙江南部区域, 秸秆火多集中在浙江北部区域;南方多林火北方多秸秆火主要受浙江植被分布影响, 浙江北部地势较为平坦, 以农作物种植为主, 在作物收获季节多以焚烧为主, 南方多丘陵地带, 以森林为主要植被类型, 由于人类活动导致林火在南方频繁发生.
 |
| 图 3 2001—2016年浙江区域露天生物质火密度空间分布 Fig. 3 The spatial distribution of fire density of the open biomass burning in Zhejiang during 2001—2016 |
图 4显示2001—2016年浙江区域森林和草地火灾年季波动较大. 2004、2008和2011年林火和草地火灾次数皆达到极大值, 森林火灾次数分别为137、365和252次;草地火灾分别为22、49和26次;2001—2016年浙江省秸秆火次数总体呈先增加后降低趋势, 该研究结果与Jin等(2018)和Li等(2016)研究结果一致.
 |
| 图 4 2001—2016年浙江区域森林、草地和秸秆火点时间变化 Fig. 4 The temporal change of the fire ignitions of forest, grass and crop straw burning in Zhejiang during 2001—2016 |
图 5显示浙江区域森林和草地火灾次数月变化存在差异, 呈双峰分布, 火点峰值(3月)高于峰值(10月).时间上林火在2、3、4和10月份火灾发生比率分别为20.96%、31.88%、15.03%和13.07%;草地火在2、3、4和10月份火灾发生比率18.48%、21.33%、12.80%和19.43%;作物火点在5、7和8月份火灾发生比率25.40%、25.36%和24.78%. 2、3和4月浙江区域处于春季, 上一年度死亡生物质积累较多, 春季气温回暖快且降水少, 使得地表温度升高较快, 加速凋落物及地表可燃物水分蒸发, 有利于林火形成, 同时4月林火主要受到传统习俗影响较大, 清明节前后祭奠先人, 上坟时通过稻草、草本、凋落物、灌丛等森林可燃物引发林火发生(Qiu et al., 2016;Wu et al., 2018);10月为秋季, 草本植物大量死亡, 且降水少, 空气湿度低和风速大, 加快可燃物干燥, 降低植被含水率, 促进林火形成与发展;夏季浙江区域雨热同期, 植被处于生长季节, 含水量极高, 冬季浙江为低温多雨区域, 不利于林火发生. 5、7和8月集中全年秸秆火76%, 研究显示秸秆火点主要受到区域焚烧习惯、当地人口、当地经济水平和地方政策等因素影响, 尽管政府出台一系列秸秆禁烧政策, 仍有较多秸秆在收获或播种季节被燃烧, 且收获季节有更多秸秆就地焚烧, 研究显示秸秆露天焚烧与农村人口、区域经济水平和秸秆产量呈显著正相关;因此显示森林和草地火灾主要为自然因素影响, 秸秆火灾主要为人文因素影响较大, 人为活动也是引发林火的主要影响因子(Wu et al., 2018;Zhou et al., 2018).
 |
| 图 5 2001—2016年浙江区域森林、草地和秸秆火点月变化 Fig. 5 The monthly variation of fire ignitions of forest, grass and crop straw burning in Zhejiang during 2001—2016 |
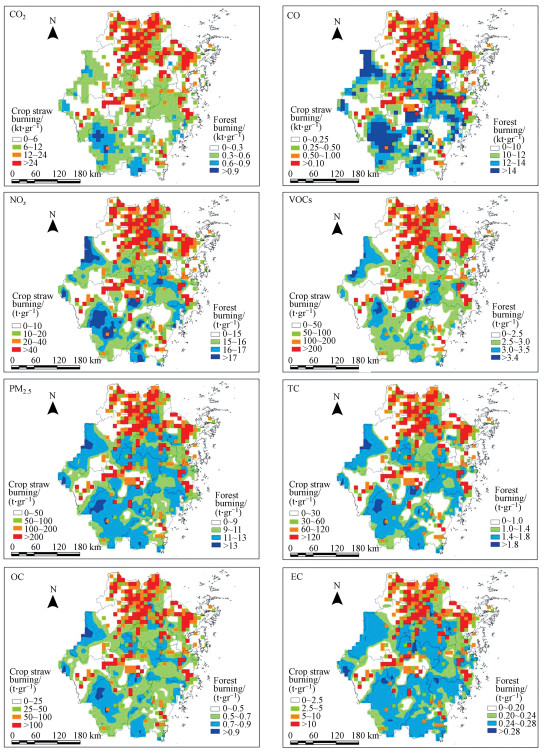
生物质燃烧排放大量污染物, 显著影响大气环境和人类健康, 本研究根据浙江区域MODIS-MCD64A1数据监测森林、灌丛、草地火灾面积和秸秆火点数据, 结合植被类型、生物质密度和燃烧效率, 运用排放因子法, 估算2001—2016年浙江区域露天生物质燃烧排放各污染物CO2、CO、NOx、VOCs、PM2.5、TC、OC和EC总量分别为:667.20、26.40、1.13、4.92、5.12、2.85、2.59和0.23 mt, 年均排放量分别为:41.70、1.65、0.07、0.31、0.32、0.18、0.16和0.01 mt. 图 6显示各污染物排放空间上不均衡, 呈南方多以森林污染物排放为主, 北方区域多以秸秆焚烧排放为主的分布特征. 图 6显示秸秆排放污染物主要集中在湖州和嘉兴市大部分区域, 杭州北部区域、宁波东北区域、台州、衢州和金华区域有少量密度较高区域分布;林火排放污染物多集中在台州与金华交汇区域、丽水与衢州交汇区域、丽水大部分区域及温州、衢州和杭州西部区域有较高林区污染物排放分布, 其他区域污染密度相对较低. Wu等(2018)研究显示浙江区域露天生物质燃烧排放CO2、CO、VOCs、PM2.5和OC年均排放量分别是39.14 mt、2.06 mt、290.9 kt、167.8 kt和91.41 kt, 该研究结果与本研究较为接近;Zhou等(2018)研究显示浙江省生物质燃烧排放CO2、CO、VOCs和PM2.5年均排放量分别为99.86、4.51、0.48和0.46 mt, 该研究结果显著高于本研究, 由于Zhou等研究所有生物质燃烧排放污染物总量, 本研究仅对露天生物质燃烧排放进行了估算, 故研究结果差异较大.研究显示森林、灌丛和草本燃烧排放主要受植被类型属性、气象因子、地形因子、基础设施、经济社会因子及人口等因素影响, 秸秆焚烧主要受到人口、经济、种植面积和经济社会因子等因素影响;森林、灌丛和草本燃烧存在明显季节性差异, 2、3、4和10月份占全年火灾80%以上, 春、秋季节降水少, 气温较高, 空气相对湿度低, 加快生物质水分蒸发, 促进有机物干燥, 有利于自然火灾发生. Guo等(2016; 2017)研究显示当年气象(平均气温、平均相对湿度和平均降水)、地形(高程、坡度和坡向)、人口密度和受教育水平与林火发生呈显著负相关, 前一年气象(平均气温、平均对湿度和平均降水)、植被覆盖度与林火发生呈显著正相关;秸秆火多集中在5、7和8月, 其占全年火灾75%以上, 焚烧多集中在收获季节后期及播种季前期, 主要受人为因子影响.
 |
| 图 6 2001—2016年浙江区域露天生物质燃烧排放污染物总量空间分布 Fig. 6 The spatial distribution of the total emission of pollutants from the open biomass burning in Zhejiang during 2001—2016 |
2001—2016年浙江区域露天生物质燃烧排放污染物CO2、CO、NOx、VOCs、PM2.5、TC、OC和EC年变化见表 3, 区域各污染物年季排放存在差异, 总体呈逐步增加趋势, 其排放强弱顺序为CO2 > CO > PM2.5 > VOCs> TC > OC > NOx >EC.
| 表 3 2001—2016年浙江区域露天生物质燃烧排放污染物时间变化 Table 3 Time change of pollutants discharged from opening biomass fire in Zhejiang during 2001—2016 |
生物质燃烧排放不确定性主要受火灾卫星产品, 生物质燃料负荷数据, 燃烧效率和排放因子等因素影响. MCD64A1数据具有较高可靠性(Giglio, 2013), Zhou等(2018)和Wu等(2018)研究指出, MCD64A1产品不确定性为20%;森林和草地生物质密度参照Ni等(2001)和Piao等(2007)研究成果, 其不确定性为50%;排放因子不确定性为3%~90%;秸秆产量和谷草比等数据来源于国家统计局, Cao等(2008)认为国家统计数据其误差在20%以内;燃烧效率是生物质燃烧排放至关重要的因子, 其受植被类型、含水率、自然环境等因素影响, 本研究为了估算的准确性和精确性, 因此以多个同一植被类型燃烧效率实测数据平均值作为本研究燃烧效率, 增强燃烧效率可靠性, 其误差控制在50%以内;综上所有因子不确定运用公式(5)和(6)定量的计算各污染物排放结果不确定性见表 4.本研究结果与Wu等(2018)和Zhou等(2018)研究结果较为接近, 陆炳等(2011)研究结果高于本研究, 本研究是对每种植被类型逐个因子分析, 降低每个因子不确定性, 确保该研究成果相对更加可靠.
| 表 4 排放源估算误差分析 Table 4 The estimation error from different emission sources |
研究显示露天生物质燃烧主要由自然(森林、灌丛、草地、沼泽)和人为(秸秆)两部分组成, 其自然火灾多受自然因素和人文因素共同作用, 秸秆火灾多是人为因素决定.政府可以适当增加科研经费, 提高科学技术, 探索自然火灾与自然因素之间关系, 建立高精度防火预测系统, 同时加强人为火源管理.其人为火源多来自刀耕火种和上坟烧纸、放鞭炮及游客不良用火习惯等, 通过提高林区周边人员及游客防火意识, 减少火源.秸秆火焚烧主要受到经济和劳动力等因素影响, 其就地焚烧是最廉价、方便和快捷的处理方式, 但其对生态环境造成严重破坏.尽管政府出台一系列秸秆禁烧政策, 但仍有较多秸秆在收获或播种季节被燃烧.为了减少秸秆就地焚烧, 秸秆主要以还田和利用再加工等方式消耗, 还田分解速率较慢影响下个播种季节作物产量, 利用再加工等方式成本较高, 农民自愿参与度不高.政府可以加强科学研究, 探索高效生物质分解方法, 促进秸秆还田, 同时政府也可以运用经济型激励政策, 鼓励秸秆回收再利用, 增加农民收入, 促进秸秆真正转变为生物质资源.
4 结论(Conclusions)1) 浙江2001 — 2016年露天生物质燃烧总产量为58.78 mt, 其中乔木、灌木、草本、水稻、小麦、玉米、豆类和油菜燃烧量分别为202.179 kt、10.43 kt、300.1 t、46.66 mt、1.94 mt、2.45 mt、3.45 mt和4.06 mt.
2) 2001—2016年浙江地区发生森林和秸秆火点分别为1783次和23257次, 不同植被类型火点空间分布不均衡, 森林火灾多集中在浙江南部区域, 秸秆火多集中在浙江北部区域.
3) 浙江区域森林和草地火点呈显著双峰分布, 火点峰值3月高于峰值10月, 秸秆火点在5、7和8月份火发生比率分别为25.40%、25.36%和24.78%.
4) 2001—2016年浙江区域露天生物质燃烧排放各污染物CO2、CO、NOx、VOCs、PM2.5、TC、OC和EC总量分别为667.20、26.40、1.13、4.92、5.12、2.85、2.59和0.23 mt, 年均排放量分别为:41.70、1.65、0.07、0.31、0.32、0.18、0.16和0.01 mt.
Akagi S K, Yokelson R J, Wiedinmyer C, et al. 2011. Emission factors for open and domestic biomass burning for use in atmospheric models[J]. Atmospheric Chemistry and Physics, 11(9): 4039–4072.
DOI:10.5194/acp-11-4039-2011
|
Alves C, Cátia G, Ana P F, et al. 2011. Fireplace and woodstove fine particle emissions from combustion of western Mediterranean wood types[J]. Atmospheric Research, 101(3): 692–700.
DOI:10.1016/j.atmosres.2011.04.015
|
Cao G L, Zhang X Y, Gong S L, et al. 2008. Investigation on emission factors of particulate matter and gaseous pollutants from crop residue burning[J]. Journal of Environmental Science, 20(1): 50–55.
DOI:10.1016/S1001-0742(08)60007-8
|
Cheng Z, Wang S, Fu X, et al. 2014. Impact of biomass burning on haze pollution in the Yangtze River delta, China:a case study in summer 2011[J]. Atmospheric Chemistry and Physics, 14(9): 4573–4585.
DOI:10.5194/acp-14-4573-2014
|
Garcia-Hurtado E, Pey J, Borrás E, et al. 2014. Atmospheric PM and volatile organic compounds released from Mediterranean shrubland wildfires[J]. Atmospheric Environment, 89(2): 85–92.
|
Giglio L, Randerson J T, Der Werf G R, et al. 2013. Analysis of daily, monthly, and annual burned area using the fourth-generation global fire emissions database (GFED4)[J]. Journal of Geophysical Research, 118(1): 317–328.
|
Guerette E, Patonwalsh C, Desservettaz M, et al. 2017. Emissions of trace gases from Australian temperate forest fires:emission factors and dependence on modified combustion efficiency[J]. Atmospheric Chemistry and Physics, 18(5): 3717–3735.
|
Guo F T, Su Z W, Wang G Y, et al. 2017. Understanding fire drivers and relative impacts in different Chinese forest ecosystems[J]. Science of the Total Environment, 605-606: 411–425.
DOI:10.1016/j.scitotenv.2017.06.219
|
Guo F T, Su Z W, Wang G Y, et al. 2016. Wildfire ignition in the forests of southeast China: Identifying drivers and spatial distribution to predict wildfire likelihood[J]. Applied Geography, 66: 12–21.
DOI:10.1016/j.apgeog.2015.11.014
|
IPCC.1997.Quantifying Uncertainties in Practice, Chapter 6.In: Good Practice Guidance and Uncertainty Management in National Greenhouse Gas Inventories[M].Bracknell: IES, IPCC, OECD
|
Jin Q F, Ma X Q, Wang G Y, et al. 2018. Dynamics of major air pollutants from crop residue burning in mainland China, 2000—2014[J]. Journal of Environmental Sciences, 70(8): 190–205.
|
靳全锋, 王文辉, 马祥庆, 等. 2017a. 福建省2000—2010年林火排放污染物时空动态变化[J]. 中国环境科学, 2017a, 37(2): 476–485.
|
靳全锋, 马祥庆, 王文辉, 等. 2017b. 华东地区2000—2014年间秸秆燃烧排放PM2.5时空动态变化[J]. 环境科学学报, 2017b, 37(2): 460–468.
|
靳全锋, 马祥庆, 王文辉, 等. 2017c. 中国亚热带地区2000—2014年林火排放颗粒物时空动态变化[J]. 环境科学学报, 2017c, 37(6): 2238–2247.
|
靳全锋, 鞠园华, 杨夏捷, 等. 2017d. 2005—2014年内蒙古草地火灾排放污染物的时空格局[J]. 草业学报, 2017d, 26(2): 21–29.
|
Jing C, Zhi G R, Chen Y J, et al. 2014. Apreliminary study on brown carbon emissions from open agricultural biomass burning and residential coal combustion in China[J]. Research of Environmental Sciences, 27(5): 455–461.
|
Kato E, Michio K Y, Kinoshita T, et al. 2011. Development of spatially explicit emission scenario from land-use change and biomass burning for the input data of climate projection[J]. Procedia Environmental Sciences, 6(1): 146–152.
|
Langmann B, Duncan B, Textor C, et al. 2009. Vegetation fire emissions and their impact on air pollution and climate[J]. Atmospheric Environment, 43(1): 107–116.
DOI:10.1016/j.atmosenv.2008.09.047
|
Levine J S. 1991. Global biomass burning:atmospheric, climatic, and biospheric implications[J]. Eos Transactions American Geophysical Union, 71(37): 1075–1077.
|
Li J, Yu Bo, Xie S D. 2016. Estimating emissions from crop residue open burning in China based on statistics and MODIS fire products[J]. Journal of Environmental Sciences, 44(6): 158–170.
|
Li M, Wang T, Xie M, et al. 2018. Agricultural fire impacts on ozone photochemistry over the Yangtze River Delta region, East China[J]. Journal of Geophysical Research:Atmospheres.
DOI:10.1029/2018JD028582
|
陆炳, 孔少飞, 韩斌, 等. 2011. 2007年中国大陆地区生物质燃烧排放污染物清单[J]. 中国环境科学, 2011, 31(2): 186–194.
|
Mundo I A, Wiegand T, Kanagaraj R, et al. 2013. Environmental drivers and spatial dependency in wildfire ignition patterns of northwestern Patagonia[J]. Journal of Environmental Management, 123(1): 77–87.
|
Ni H, Han Y, Cao J, et al. 2015. Emission characteristics of carbonaceous particles and trace gases from open burning of crop residues in China[J]. Atmospheric Environment.
DOI:10.1016/j.atmosenv.2015.05.007
|
Ni J, Zhang X S, Scurlock M O. 2001. Synthesis and analysis of biomass and net primary productivity in Chinese forests[J]. Annals of Forest Science, 58(4): 351–384.
DOI:10.1051/forest:2001131
|
Piao S, Fang J, Zhou L, et al. 2007. Changes in biomass carbon stocks in China's grasslands between 1982 and 1999[J]. Global Biogeochemical Cycles, 21(2): 1–10.
|
Qiu X, Duan L, Chai F, et al. 2016. Deriving high-resolution emission inventory of open biomass burning in china based on satellite observations[J]. Environmental Science & Technology, 50(21): 11779–11786.
|
Reche C, Viana M, Amato F, et al. 2012. Biomass burning contributions to urban aerosols in a coastal Mediterranean City[J]. Science of the Total Environment(12): 175–190.
|
Shen G, Yang Y, Wang W, et al. 2010. Emission factors of particulate matter and elemental carbon for crop residues and coals burned in typical household stoves in China[J]. Environmental Science & Technology, 44(18): 7157–7162.
|
Shi Y S, Matsunaga T, Yamaguchi Y. 2015. High-resolution mapping of biomass burning emissions in three tropical regions[J]. Environmental Science & Technology, 49(18): 10806–10814.
|
Sinha P, Hobbs P V, Yokelson R J, et al. 2018. Emissions of trace gases and particles from savanna fires in southern Africa[J]. Journal of Geophysical Research:Atmospheres, 108(D13): 8487.
DOI:10.1029/2002JD002325
|
Soares Neto T G, Carvalho Júnior J A, Veras C A G, et al. 2009. Biomass consumption and CO2, CO and main hydrocarbon gas emissions in an Amazonian forest clearing fire[J]. Atmospheric Environment, 43(2): 438–446.
DOI:10.1016/j.atmosenv.2008.07.063
|
Sun J, Peng H, Chen J, et al. 2016. An estimation of CO2 emission via agricultural crop residue open field burning in China from 1996 to 2013[J]. Journal of Cleaner Production, 112(12): 2625–2631.
|
田贺忠, 赵丹, 王艳. 2011. 中国生物质燃烧大气污染物排放清单[J]. 环境科学学报, 2011, 31(2): 349–357.
|
Udeigwe T K, Teboh J M, Eze P N, et al. 2015. Implications of leading crop production practices on environmental quality and human health[J]. Journal of Environmental Management, 151: 267–279.
|
Urbanski S P, Baker S. 2009. Chemical composition of wildland fire emissions[J]. Developments in Environmental Science, 8: 79–107.
|
Urbanski S. 2014. Wildland fire emissions, carbon, and climate:Emission factors[J]. Forest Ecology and Management, 317(2): 51–60.
|
Wu J, Kong S, Wu F, et al. 2018. Estimating the open biomass burning emissions in Central and Eastern China from 2003 to 2015 based on satellite observation[J]. Atmospheric Chemistry & Physics: 1–49.
DOI:10.5194/acp-2018-282
|
Yan X Y, Ohara T, Akimoto H. 2006. Bottom-up estimate of biomass burning in mainland China[J]. Atmospheric Environment, 40(27): 5262–5273.
DOI:10.1016/j.atmosenv.2006.04.040
|
Yokelson R J, Christian T J, Karl T, et al. 2008. The tropical forest and fire emissions experiment:Laboratory fire measurements and synthesis of campaign data[J]. Atmospheric Chemistry and Physics, 8(13): 3509–3527.
DOI:10.5194/acp-8-3509-2008
|
Zha S, Zhang S, Cheng T, et al. 2013. Agricultural fires and their potential impacts on regional air quality over China[J]. Aerosol Air Qual Res, 13(3): 992–1001.
DOI:10.4209/aaqr.2012.10.0277
|
Zhang H, Ye X, Cheng T, et al. 2008. A laboratory study of agricultural crop residue combustion in China:emission factors and emission inventory[J]. Atmospheric Environment, 42(36): 8432–8441.
DOI:10.1016/j.atmosenv.2008.08.015
|
Zhang X, Lu Y, Wang Q, et al. 2018. A high-resolution inventory of air pollutant emissions from crop residue burning in China[J]. Atmospheric Chemistry and Physics: 1–19.
DOI:10.5194/acp-2017-1113
|
Zhang Y S, Min S, Yun L, et al. 2013. Emission inventory of carbonaceous pollutants from biomass burning in the Pearl River Delta region, China[J]. Atmospheric Environment, 76(5): 189–199.
|
Zhang Y, Tang L, Croteau P L, et al. 2017. Field characterization of the PM2.5 Aerosol Chemical Speciation Monitor:insights into the composition, sources, and processes of fine particles in eastern China[J]. Atmospheric Chemistry & Physics, 17(23): 14501–14517.
|
Zhou X C, Wang X Q. 2006. Validate and improvement on arithmetic of identifying forest fire based on EOS-MODIS Data[J]. Remote Sensing Technology & Application, 21(3): 206–211.
|
Zhou Y, Xing X, Lang J, et al. 2017. A comprehensive biomass burning emission inventory with high spatial and temporal resolution in China[J]. Atmospheric Chemistry and Physics, 17(4): 2839.
DOI:10.5194/acp-17-2839-2017-supplement
|
Zong Z, Wang X, Tian C, et al. 2016. Biomass burning contribution to regional PM2.5 during winter in the North China[J]. Atmospheric Chemistry and PhysicsDiscussions, 16: 1–41.
DOI:10.5194/acp-2016-97
|
 2019, Vol. 39


