 2019, Vol. 39


近年来, 世界各国对全氟化合物(perfluoroalkyl substances, PFASs)的研究越来越多, 我国对其关注度也越来越高.全氟化合物是一类有机化合物分子中的碳原子所连接的氢原子全部被氟原子取代的化合物, 其化学通式为CnF2n+1-R.由于PFASs含有极高键能的C—F键(约460 kJ·mol-1), 所以该类化合物具有很强的化学稳定性、表面活性、热稳定性及疏水疏油性等, 从而使得PFASs被广泛应用于各个方面, 如生活消费和工业生产等.
PFASs特殊的理化性质导致其不易被分解, 可以在环境中长久存在, 并且能够在生物体发生富集, 可以通过食物链产生生物放大效应(Fang et al., 2014; 2016).研究表明, PFOS和PFOA都会对生物体的生长、发育、生殖系统等产生毒害作用, 而PFOA可能诱发生物体发生癌变(Newsted et al., 2005; Taniyasu et al., 2005; Yu et al., 2009; Wang et al., 2010).所以, 早在2009年全氟辛烷磺酸(perfluorooctane sulfonate, PFOS)及其盐类和它的前体物质-全氟辛基磺酰氟(perfluorooctane sulfonyl fluoride, POSF)就被斯德哥尔摩公约列为限制性使用的持久性有机污染物.
由于PFASs在工业及生活中的广泛使用, 使得大量的PFASs进入自然环境.目前, 已经在河流、湖泊、土壤、生物等不同介质中被广泛检出(Chen et al., 2015; Domingo et al., 2017; Gebbink et al., 2017; Chen et al., 2018; Dassuncao et al., 2018).即使是在遥远的北极地区, 也有PFASs被检出(Aas et al., 2014; Shoeib et al., 2006).全氟化合物会对人体和生物体带来一定的健康风险, 因此, 探索人体暴露于全氟化合物的途径很有必要.现有的研究表明, 饮食及室内灰尘是人体暴露于PFASs的重要来源(Zhang et al., 2010; Eriksson et al., 2015).由于PFASs的疏水疏油的特性, 导致其在水中的浓度相对较低, 对人体进行健康风险评估时, 饮用水通常不被考虑在内.然而, 饮用水作为人们每日必须摄入的介质, 其中PFASs对人体的影响也不应该被完全忽略.另外, 虽然近年来对PFASs健康风险评估的研究众多(So et al., 2006; Zhao et al., 2011), 但针对四川省的研究却几近空白.因此, 本研究选取四川省不同地区自来水中全氟化合物作为研究对象, 分析全氟化合物的污染特征, 为评估人体健康风险等提供基础性的科学依据.
2 实验材料与方法(Materials and methods) 2.1 样品采集为了避免污染, 本研究采用聚丙烯采样瓶进行采样.采样前用甲醇和超纯水清洗干净.每个样品均装满样品瓶, 保证瓶内无气泡, 所有样品在采集后均放入冰箱中(-4 ℃)保存.本研究采集了四川省10个地区的自来水水样, 样品采集点包括成都(成都市市区, n=12)、攀枝花(盐边县, n=3)、甘孜(康定城区, n=3)、凉山彝族自治州(冕宁县, n=3)、广安(岳池县城区, n=3)、巴中(巴中市市区, n=3)、绵阳(绵阳市市区, n=3)、达州(宣汉县城区, n=3)、南充(南充市市区, n=3)和宜宾(宜宾市市区, n=3), 每个地区1~4个采样点位, 每个点位采集3个平行样.
2.2 实验材料本研究中的标准样品为高纯度混合标准品PFAC-MXB(Wellington公司), 含有羧酸类和磺酸类全氟化合物.其中, 羧酸类包括:全氟己酸(perfluorohexanoate, PFHxA)、全氟辛酸(perfluroroocantanoic acid, PFOA)、全氟壬酸(perfluorononanoate, PFNA)、全氟癸酸(perfluorodecanoate, PFDA)、全氟十一烷酸(perfluoroundecanoate, PFUnDA)、全氟十二烷酸(perfluorododecanoate, PFDoDA)、全氟十三烷酸(perfluorotridecanoic acid, PFTrDA)、全氟十四烷酸(perfluorotetradecanoic acid, PFTeDA).磺酸类包括:全氟丁烷磺酸(perfluorobutane sulfonate, PFBS)、全氟己烷磺酸(perfluorohexane sulfonate, PFHxS)、全氟辛烷磺酸(perfluorooctane sulfonate, PFOS)和全氟癸基磺酸(perfluorodecanesulfonic acid, PFDS).另外, PFAC-MXA为高纯度混合内标, 包括:13C2-PFHxA、13C4-PFOA、13C5-PFNA、t13C2-PFDA、13C2-PFUnA、13C2-PFDoA、18O2-PFHxS和13C4-PFOS.
本研究使用的主要实验试剂包括甲醇(分析纯/99.5%、色谱纯/99.8%, 成都市科隆化工试剂厂)、氨水(25%, 成都市科隆化工试剂厂)、Milli-Q超纯水.
2.3 样品前处理方法水样前处理方法参照Chen等(2015)的方法, 每个自来水样取500 mL, 加入2 ng内标.然后用Cleanert PEP(500 mg/6 mL, 天津博纳艾杰尔科技有限公司)固相萃取柱富集并纯化, 具体操作如下:分别用10 mL甲醇和10 mL超纯水对固相萃取柱进行活化.活化完成后, 加入内标的水样以1滴·秒-1的速度过萃取柱.萃取完成后平衡1 h, 然后用5 mL 20%的甲醇/H2O溶液去除杂质, 最后用10 mL甲醇洗脱目标化合物至15 mL离心管中.洗脱液置于氮吹仪中, 氮吹近干, 然后用0.6 mL甲醇和0.4 mL H2O复溶, 5000 r · min-1离心后过0.22 μm尼龙针头过滤器, 转移至样品瓶中, 于-18 ℃冰柜中保存, 等待上机测样.
2.4 仪器分析方法本研究采用安捷伦液相色谱-质谱联用仪(1290/6470)、C18色谱柱(Zorbax SB-C18, 2.1 mm× 50 mm, 1.8 μm)对目标化合物进行定性和定量分析.方法进样量为5 μL, 流动相为水(A相)和甲醇(B相), 流速为0.4 mL · min-1, 流动相梯度设置如下:0~0.10 min, A相比例为90%;0.10~6.00 min, A相比例由90%降为5.00%;6.00~8.00 min, A相比例保持为5.00%, 仪器后运行2 min.质谱条件的设定如下:雾化气压力35 psi;干燥气温度250 ℃.对目标化合物定量离子的选择, 碎裂能和碰撞能优化参数见表 1.
| 表 1 目标物定量离子、仪器参数及保留时间 Table 1 Quantitative ion, instrument parameters and retention time |
本实验采用内标法定量分析, 为减小实验的背景误差, 实验过程中避免使用玻璃及含有聚四氟乙烯的容器, 且实验过程中使用的容器均用甲醇和超纯水清洗.前处理过程中, 每10个样品设置2个方法空白来监测前处理过程中的背景值;在仪器分析过程中, 每12个样品设置1个溶剂空白来监控仪器的污染状态.
本研究的方法检测限(method detection limits, MDLs)定义如下:①对于没有在空白样品中检测出的PFASs, 其MDLs值为3倍信噪比时的浓度;②对于在空白样品中检测到的PFASs, 其MDLs值为空白样品中浓度的均值加上3倍的标准偏差.在分析实际样品的数据时, 检测值低于MDLs值时, 用MDLs值除以
| 表 2 全氟化合物在自来水中的方法检出限及回收率 Table 2 Method detection limits and recoveries of PFASs in tap water |
由加标回收率(10 ng·L-1)实验得出水样中12种全氟化合物的回收率在69%~121%, 其中PFDS的回收率为69%, PFTeDA的回收率为121%, 其余10种全氟化合物的回收率都介于70%~120%(表 2).实际样品中内标物的回收率为73%~124%, 回收率良好, 无需对结果进行校正.
3 结果分析与讨论(Results and discussion) 3.1 不同地区自来水中全氟化合物的浓度水平研究结果显示, 四川省不同地区自来水中∑PFASs的浓度为4.17~41.20 ng·L-1(图 1).其中, 浓度最高的地区为宜宾(41.20 ng·L-1), 然后依次为巴中(40.90 ng·L-1)>凉山州(14.90 ng·L-1)≈广安(14.50 ng·L-1)>南充(11.40 ng·L-1)≈达州(10.70 ng·L-1)>甘孜(7.27 ng·L-1)>攀枝花(6.07 ng·L-1)>成都(4.72 ng·L-1)>绵阳(4.17 ng·L-1).Mak等(2009)调查研究了中国不同城市自来水中PFASs的污染水平, 其中上海市最高, 为130 ng·L-1, 而北京市仅为0.71 ng·L-1.四川不同地区自来水中PFASs浓度低于上海, 但仍高于北京市.宜宾处于氟工业园区的下风向, 这可能是导致宜宾地区自来水PFASs浓度较高的一个主要原因.而巴中地区的工业园主要涉及医药、轻纺、机械、新型材料加工等行业, 在产品加工过程中会使用到全氟化合物的相关产品, 而本次采样点位于巴中市巴中区, 有工业园位于此地.周珍等(2017)和Sun等(2011)的研究结果显示污水处理厂进水和出水中全氟化合物浓度变化不大, 说明现有的污水处理工艺对全氟化合物去除效果并不明显.Takagi等(2008)的研究结果指出, 自来水厂现有的工艺对PFASs的去除效率极低.因此, 使用全氟化合物工厂的处理污水进入地表水后可能会对当地自来水造成影响.这可能是巴中自来水中PFASs较高的重要原因.
 |
| 图 1 四川省不同地区自来水中全氟化合物的浓度分布 Fig. 1 Concentration distribution of PFASs in tap waters collected from different areas of Sichuan Province |
值得关注的是, 尽管成都和绵阳是四川省经济较为发达地区, 但相对于四川省其它地区, 成都及绵阳自来水中PFASs的浓度反而较低.这与之前的调查结果恰好相反.Xie等(2013)在2013年的研究结果中指出, PFASs在中国的排放量受当地经济的影响, 经济发展水平较好的东部地区较早引入氟化工园区, 排放的PFASs明显高于西部地区.由于Xie等的调查数据是2001—2011年, 而近年来较多工厂考虑到政策扶持及生产成本, 搬迁至其它经济稍微落后的地区, 最终导致了PFASs在成都、绵阳等经济发达地区的污染浓度反而较低, 因此, 今后应加强对于经济相对落后地区的环境调查研究.
PFOS和PFOA是环境中最常见的PFASs, 也是大家关注研究最多的PFASs, 因此, 本研究选取PFOS和PFOA来分析四川自来水中PFASs的污染水平.由表 3可以看出, 四川省自来水中PFOS浓度和河北省石家庄相当, 低于日本、上海、香港、台北、澳门、济南、广州等地, 但仍要高于荷兰、北京、沈阳、长春、西安、重庆、乌鲁木齐等地.而PFOA的浓度水平低于美国杜邦公司华盛顿工厂(全氟化合物生产厂家)周围自来水, 及日本、德国、上海和广州等地, 但仍高于荷兰、法罗群岛、北京、香港、澳门、沈阳、长春等地.通过比较可以看出, 四川地区自来水中PFOA在国内外处于一个中等的污染水平.
| 表 3 不同地区自来水中PFOA和PFOS的浓度 Table 3 Concentrations of PFOA and PFOS in tap waters from different areas |
四川地区PFASs浓度在一个中等污染水平, 说明四川省存在一定的面源污染.全氟化合物在环境中的主要迁移扩散方式有两种:①全氟化合物进入大气, 随气流发生迁移转化;②水体是PFASs在环境中的一个重要的汇, PFASs进入水体后会发生水相-沉积物之间的分配, 也会进入生物体内发生富集, 同时还会随水体发生长距离迁移.四川地处盆地, 地理因素导致污染物不易通过大气扩散出去, 在本区域内聚积, 最终通过沉降进入水体, 从而使得区域内污染物浓度较高.而污水处理厂及自来水厂现有的工艺对全氟化合物的去除效果甚微(Sun et al., 2011; Takagi et al., 2008), 从而导致地表水及自来水中PFASs的含量较高.因此, 应加紧对污水处理厂及自来水厂去除PFASs工艺的研究, 来确保饮用水的安全.
3.2 四川省自来水中PFASs的比例特征全氟化合物在所有采样地区自来水中均有不同程度的检出, 说明了PFASs污染的普遍存在.其中PFHxA、PFHxS、PFOA、PFOS、PFNA、PFDA、PFDS的检出率为100%, 而长碳链的PFUnDA、PFDoDA、PFTrDA、PFTeDA的检出率略低, 分别为90%、70%、70%和80%.由图 2可以看出, 四川省不同地区自来水中的PFASs主要为PFOA, 浓度在1.17~36.3 ng·L-1, 占∑PFASs的比例8.4%~89%.除宜宾(8.4%)、绵阳(28%)和广安(45%)外, 其他地区中PFOA的比例均大于50%, 巴中地区高达89%.其次为PFHxA、PFOS和PFNA.而长碳链的PFASs(C≥11)在自来水中的浓度及检出率都低于短碳链的(C≤6)和中碳链(7≤C≤10)的PFASs.Chen等(2018)在辽宁阜新地下水中也发现了同样的规律.Zhao等(2012)指出, PFASs碳链越长, 其Kow值越大, 因此, 越容易向沉积物中分配, 从而导致水相中浓度较低.这可能是自来水中长链PFASs检出率低及浓度较低的原因.
 |
| 图 2 不同地区自来水中PFASs的比例特征 Fig. 2 Proportional characteristics of PFASs in tap water in different regions |
PFOA和PFNA主要作为乳化剂生产全氟聚合物, 我国生产的PFOA主要作为乳化剂用于含氟聚合物的生产, 主要生产的含氟聚合物包括氟树脂和氟橡胶两大类, 其制品可应用于机械、化工、石油、电子等各个行业.PFOS主要用于纺织业、电镀、消防和半导体工业等.Xie等(2013)的调查结果显示, 仅2010年, 我国就生产了200~250 t PFOS, 其中有70 t直接或间接的排放到环境当中去.另外, 全氟辛烷磺酰氟(POSF)是PFOS的重要前体物质, 在环境中最终降解为PFOS(Wang et al., 2014).Paul等(2009)指出, 1970—2012年间, 全球共向环境中排放POSF约45250 t.PFOS及其前体物质的大量使用, 是PFOS在环境中浓度较高的主要原因.
另外, 现有的研究表明, 长碳链的PFASs具有较强的生物富集能力和生物毒性(Martin et al., 2003; Fuentes et al., 2007), 致使人们开始寻找对环境危害更小的短碳链全氟化合物(Kleszczynski et al., 2007), 作为替代品应用于工业生产中, 造成近年来环境中PFHxA等短碳链PFASs浓度呈现出升高的趋势.
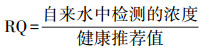
4 健康风险评估(Health risk assessment) 4.1 暴露风险评估方法美国环境保护署(Environmental Protection Agency, EPA)及明尼苏达州卫生部(U.S. Environmental Protection Agency, 2009; Minnesota Department of Health, 2007)推荐采用风险商值(risk quotients, RQs)来评估自来水中PFASs对人体的健康风险.具体公式见式(1).
|
(1) |
RQ < 1, 代表无健康风险;RQ>1, 代表可能存在健康风险.由于目前对自来水中全氟化合物健康推荐值的研究还是相当的匮乏, 已知健康参照指标的全氟化合物主要为以下几种物质(表 4).
| 表 4 自来水中部分PFASs的健康推荐值 Table 4 Advisory guideline values of PFASs in tap water |
由图 3可以看出, 10个不同地区自来水中, PFOA的风险商值最大, 其次为PFOS和PFHxA.PFHxA只在宜宾地区自来水中呈现出较高的RQs值, 其它地区均较低.PFASs在所有自来水中的暴露风险指数均小于1, 这表明该10个地区自来水中PFASs的健康风险较小, 不会对人体造成直接伤害.
 |
| 图 3 四川省不同地区自来水中PFASs的暴露风险商值 Fig. 3 Exposure risk quotients of PFASs in tap water collected from different areas of Sichuan Province, China |
1) 四川省10个地区自来水中12种全氟化合物的浓度在4.17~41.2 ng·L-1, 其中以宜宾的自来水中全氟化合物的浓度最高, 绵阳最低.
2) 自来水中主要的PFASs为中短碳链的(PFHxA、PFOA、PFOS和PFNA)全氟化合物, 而长碳链的PFASs的浓度水平及检出较低.
3) 四川地区自来水中PFOS、PFOA、PFHxS、PFBS和PFHxA的风险商值均小于1, 不会对当地居民带来直接的健康风险.
Aas C B, Fuglei E, Herzke D, et al. 2014. Effect of body condition on tissue distribution of perfluoroalkyl substances (PFASs) in Arctic Fox (Vulpes lagopus)[J]. Environmental Science & Technology, 48: 11654–11661.
|
Chen H, Yao Y M, Zhao Z, et al. 2018. Multimedia distribution and transfer of per-and polyfluoroalkyl substances (PFASs) surrounding two fluorochemical manufacturing facilities in Fuxin, China[J]. Environmental Science & Technology, 52: 8263–8271.
|
Chen X W, Zhu L Y, Pan X Y, et al. 2015. Isomeric specific partitioning behaviors of perfluoroalkyl substances in water dissolved phase, suspended particulate matters and sediments in Liao River Basin and Taihu Lake, China[J]. Water Research, 80: 235–244.
DOI:10.1016/j.watres.2015.04.032
|
Dassuncao C, Hu X D C, Nielsen F, et al. 2018. Shifting global exposures to poly-and perfluoroalkyl substances (PFASs) evident in longitudinal birth cohorts from a seafood-consuming population[J]. Environmental Science & Technology, 52: 3738–3747.
|
Domingo J L, Nadal M. 2017. Per-and polyfluoroalkyl substances (PFASs) in food and human dietary intake:A review of the recent scientific literature[J]. Journal of Agricultural and Food Chemistry, 65: 533–543.
DOI:10.1021/acs.jafc.6b04683
|
Eriksson U, Kärrman A. 2015. World-wide indoor exposure to polyfluoroalkyl phosphate esters (PAPs) and other PFASs in household dust[J]. Environmental Science & Technology, 49: 14503–14511.
|
Eriksson U, Karrman A, Rotander A, et al. 2013. Perfluoroalkyl substances (PFASs) in food and water from faroe islands[J]. Environ Sci Pollut Res Int, 20: 7940–7948.
DOI:10.1007/s11356-013-1700-3
|
Fang S H, Chen X W, Zhao S Y, et al. 2014. Trophic magnification and isomer fractionation of perfluoroalkyl substances in the food web of Taihu Lake, China[J]. Environmental Science & Technology, 48: 2173–2182.
|
Fang S H, Zhang Y F, Zhao S Y, et al. 2016. Bioaccumulation of perfluoroalkyl acids including the isomers of perfluorooctane sulfonate in carp (Cyprinus carpio) in a sediment/water microcosm[J]. Environmental Toxicology and Chemistry, 35: 3005–3013.
DOI:10.1002/etc.v35.12
|
Fuentes S, Vicens P, Colomina M, et al. 2007. Behavioral effects in adult mice exposed to perfluorooctane sulfonate (PFOS)[J]. Toxicology, 242: 123–129.
DOI:10.1016/j.tox.2007.09.012
|
Gebbink W A, Van Asseldonk L, Van Leeuwen S P J. 2017. Presence of emerging per-and polyfluoroalkyl substances (PFASs) in river and drinking water near a fluorochemical production plant in the netherlands[J]. Environmental Science & Technology, 51: 11057–11065.
|
Hoffman K, Webster T F, Bartell S M, et al. 2011. Private drinking water wells as a source of exposure to perfluorooctanoic acid (PFOA) in communities surrounding a fluoropolymer production facility[J]. Environmental Health Perspectives, 119: 92.
DOI:10.1289/ehp.1002503
|
Jin Y H, Liu W, Sato I, et al. 2009. PFOS and PFOA in environmental and tap water in China[J]. Chemosphere, 77: 605–611.
DOI:10.1016/j.chemosphere.2009.08.058
|
Kleszczynski K, Gardzielewski P, Mulkiewicz E, et al. 2007. Analysis of structure-cytotoxicity in vitro relationship (SAR) for perfluorinated carboxylic acids[J]. Toxicology in Vitro, 21: 1206–1211.
DOI:10.1016/j.tiv.2007.04.020
|
Mak Y, Taniyasu S, Yeung L, et al. 2009. Perfluorinated compounds in tap water from China and several other countries[J]. Environmental Science & Technology, 43: 4824.
|
Martin J W, Mabury S A, Solomon K R, et al. 2003. Bioconcentration and tissue distribution of perfluorinated acids in rainbow trout (Oncorhynchus mykiss)[J]. Environmental Toxicology and Chemistry, 22: 196–204.
DOI:10.1002/etc.v22:1
|
Minnesota Department of Health. 2007. Perfluorochemicals and health: Environmental Health, Division of Environmental Health, Minnesota Department of Health
|
Newsted J L, Jones P D, Coady K, et al. 2005. Avian toxicity reference values for perfluorooctane sulfonate[J]. Environmental Science & Technology, 39: 9357–9362.
|
Paul A G, Jones K C, Sweetman A J. 2009. A first global production, emission, and environmental inventory for perfluorooctane sulfonate[J]. Environmental Science & Technology, 43: 386–392.
|
Shoeib M, Harner T, Vlahos P. 2006. Perfluorinated chemicals in the arctic atmosphere[J]. Environmental Science & Technology, 40: 7577–7583.
|
So M, Yamashita N, Taniyasu S, et al. 2006. Health risks in infants associated with exposure to perfluorinated compounds in human breast milk from Zhoushan, China[J]. Environmental Science & Technology, 40: 2924–2929.
|
Sun H W, Li F S, Zhang T, et al. 2011. Perfluorinated compounds in surface waters and WWTPs in Shenyang, China:mass flows and source analysis[J]. Water Research, 45: 4483–4490.
DOI:10.1016/j.watres.2011.05.036
|
Takagi S, Adachi F, Miyano K, et al. 2008. Perfluorooctanesulfonate and perfluorooctanoate in raw and treated tap water from Osaka, Japan[J]. Chemosphere, 72: 1409–1412.
DOI:10.1016/j.chemosphere.2008.05.034
|
Taniyasu S, Kannan K, So M K, et al. 2005. Analysis of fluorotelomer alcohols, fluorotelomer acids, and short-and long-chain perfluorinated acids in water and biota[J]. Journal of Chromatography A, 1093: 89–97.
DOI:10.1016/j.chroma.2005.07.053
|
U.S. Environmental Protection Agency. 2009. Provisory Health Advisory for Perfluorooctanoic Acid (PFOA) and Perfluorooctane Sulfonate (PFOS)[OL]. 2009-01-08. https: //www.epa.gov/sites/production/files/2015-09/documents/pfoa-pfos-provisional.pdf
|
Wang F, Liu W, Jin Y, et al. 2010. Transcriptional effects of prenatal and neonatal exposure to PFOS in developing rat brain[J]. Environmental Science & Technology, 44: 1847–1853.
|
Wang Z, Cousins I T, Scheringer M, et al. 2014. Global emission inventories for C4~C14 perfluoroalkyl carboxylic acid (PFCA) homologues from 1951 to 2030, Part Ⅰ:production and emissions from quantifiable sources[J]. Environment International, 70: 62–75.
DOI:10.1016/j.envint.2014.04.013
|
Wilhelm M, Bergmann S, Dieter H. 2010. Occurrence of perfluorinated compounds (PFCs) in drinking water of North Rhine-Westphalia, Germany and new approach to assess drinking water contamination by shorter-chained C4-C7 PFCs[J]. International Journal of Hygiene and Environmental Health.
|
3M. 2000.3M phase-out plan for POSF-based products[OL].2000-07-07.http://www.fluoridealert.org/wp-content/pesticides/pfos.fr.final.docket.0009.pdf
|
Xie S W, Wang T Y, Liu S J, et al. 2013. Industrial source identification and emission estimation of perfluorooctane sulfonate in China[J]. Environment International, 52: 1–8.
DOI:10.1016/j.envint.2012.11.004
|
Yu W G, Liu W, Jin Y H, et al. 2009. Prenatal and postnatal impact of perfluorooctane sulfonate (PFOS) on rat development:A cross-foster study on chemical burden and thyroid hormone system[J]. Environmental Science & Technology, 43: 8416–8422.
|
Zhang T, Sun H W, Wu Q, et al. 2010. Perfluorochemicals in meat, eggs and indoor dust in China:Assessment of sources and pathways of human exposure to perfluorochemicals[J]. Environmental Science & Technology, 44: 3572–3579.
|
Zhao L X, Zhu L Y, Yang L P, et al. 2012. Distribution and desorption of perfluorinated compounds in fractionated sediments[J]. Chemosphere, 88: 1390–1397.
DOI:10.1016/j.chemosphere.2012.05.062
|
Zhao Y G, Wan H T, Law A Y S, et al. 2011. Risk assessment for human consumption of perfluorinated compound-contaminated freshwater and marine fish from Hong Kong and Xiamen[J]. Chemosphere, 85: 277–283.
DOI:10.1016/j.chemosphere.2011.06.002
|
周珍, 胡宇宁, 史亚利, 等. 2017. 武汉地区水环境中全氟化合物污染水平及其分布特征[J]. 生态毒理学报, 2017(12): 425–433.
|